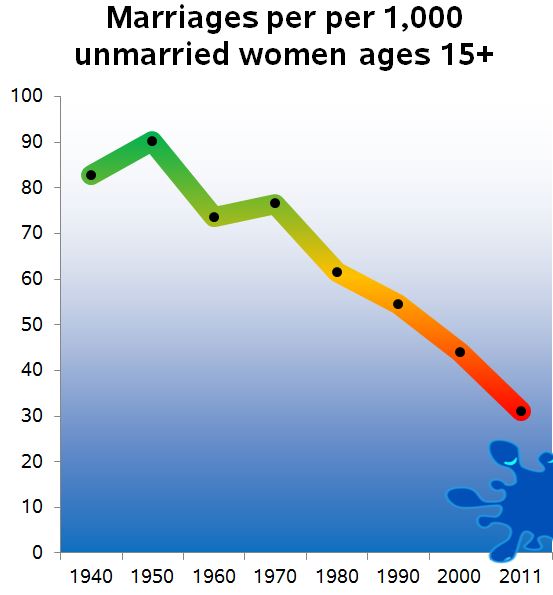
The marriage rate has fallen almost continuously for more than half a century, from a sky-high 90 per 1,000 unmarried women in 1950 (meaning almost 1 in 10 single women got married that year) to a bare 31 per 1,000 in 2011. Splashdown appears imminent.
Sources: 1940-1960; 1970-2011.
Social scientists understand that there is a combination of demographic, economic, policy, and cultural factors involved. These include the aging population, men’s declining fortunes, the incarceration of millions of poor men, the rise of secular ideology and the sexual revolution.
Often, however, cultural influence is left to what you might call residual interpretation. Proving that culture affects demographic trends is difficult. Instead, people consider how demographic, economic and policy factors play their roles, and then attribute what’s left of the trend to culture.
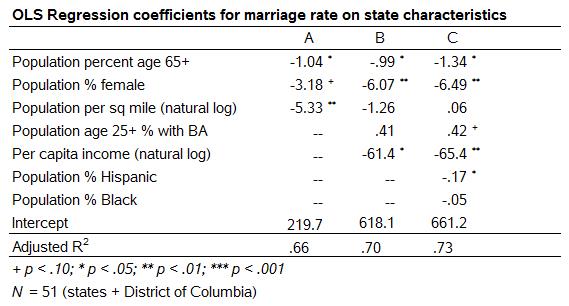
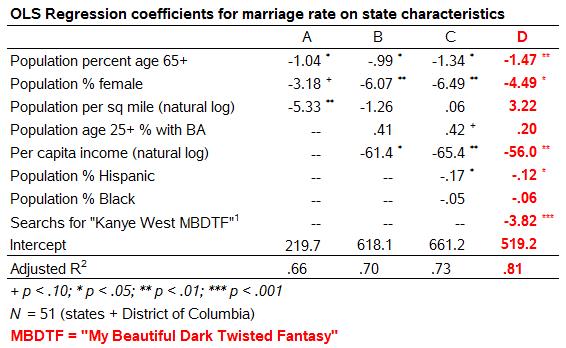
Recently, the National Center for Family and Marriage Research at Bowling Green University reported the marriage rate for each state and D.C., ranging from 61 marriages per 1,000 unmarried women in Utah down to 19 per 1,000 in Washington, D.C. and 20 in Rhode Island. To explain the pattern using normal demographic practices, I gathered some other data about states from the Census Bureau: The percent of the population over 65, percent female, percent with a BA or higher education, population density, per capita income and race/ethnic composition. With that information – using a regression – I can guess the marriage rate to within 3.1 points on average. This is what the regression looks like, showing what happens when I start with age and sex composition, add income and education, and then add race/ethnicity:
In statistical terms (R2), my simple model explains 73 percent of the variation in marriage rates, which is pretty good. Before I would use the marriage rate as an indicator of something like “culture,” then, I would say most of what’s going on reflects larger demographic and economic patterns that we more or less understand. The differences that remain, however, still might be the result of cultural, religious, or attitudinal factors that are harder to assess. (I stress this is not about low Black marriage rates: note the population percentage Black has no effect once the other factors are controlled.)
Culture, meet big data
What about big data, the billions of bits of information people leave strewn around wherever they go? Marketers and government spying agencies make most of the headlines, but social scientists, too, are scraping up millions of words and turning them into analyzable numbers, so they can tell you things like:
- Which words are most closely associated with men versus women in the New York Times? Men: prime, baseball, official, capital, governor. Women: pregnant, husband, suffrage, breast, gender.
- Do whites do more racist Google searches in states with larger black populations? Yes, fitting a longstanding pattern of racism flaring up in places with greater minority representation.
- Did Obama crush Romney in states where people search for Top Chef? (Obviously.)
- For many others, follow the Google tag.
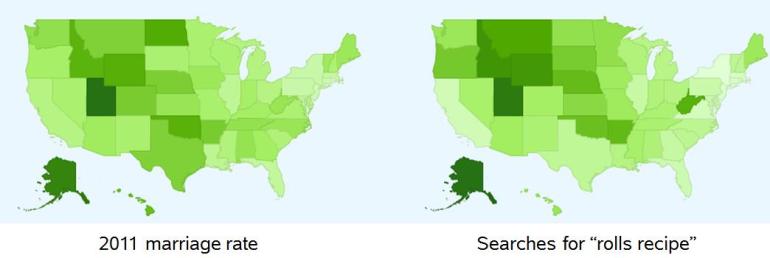
One of the easiest sources to use for this kind of thing is the Google Correlate tool, which finds the search terms whose frequency most closely follows a specified pattern. I entered the marriage rate for each state, shown on the map on the left, with darker green indicating higher marriage rates. Google Correlate tells me which searches track this variation: which searches are most popular in Utah, least popular in D.C., and so on. (I actually trimmed the Utah rate to it wouldn’t be such an outlier, from 61 down to 57, just above the next highest). It turns out the most correlated search is for “rolls recipe,” which is correlated with the marriage rate at .85 on a scale of -1 to 1.
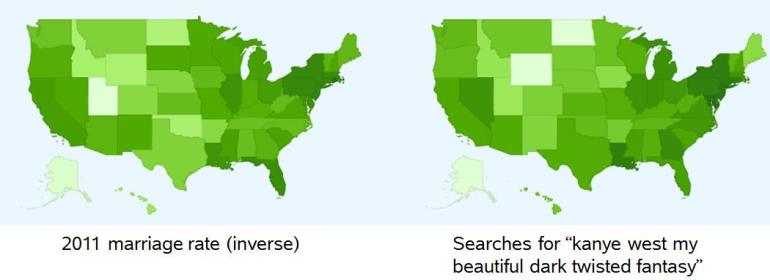
But since my interest is in the decline of marriage, I multiplied the marriage rate by -1 and tried again (so now darker green indicates a lower marriage rate). The answer, overwhelmingly: Kanye West. (Experts at finding any website anywhere will know that he’s a never-married proud father-to-be with co-parent Kim Kardashian.)
That correlation between the inverse of the 2011 marriage rate and “kanye west my beautiful dark twisted fantasy” (his last album) is .81. Further, Google produces the top 100 most correlated searches, and of those, no fewer than 28 were about Kanye West (such as “kanye west new album,” “devil in a new dress lyrics” and “air yeezys”). Another 16 were other hip-hop searches, including some about Jay Z and Lil Wayne. Other apparent themes include mafia-related entertainment (“sopranos episode,” “pacino movies,” “corleone”) Sex and the City, and shopping at Marshalls.
Does this tell us more than the simple demographic analysis I did above? When I put the top Kanye search into my model, it has the strongest effect, and the variance explained jumps to 81 percent. The model now can predict the marriage rate to within 2.5 points on average. It’s a very good predictor, and it’s not just reflecting simple demographics like age, gender and race. Whether Kanye is in the analysis or not, Black population percentage has no effect on this prediction. Here is the regression, with new parts in red:
Explanations
So, I dredged all the search data in the world for something correlated with marriage rates, and found something. But what does it mean? Two cautionary stories are revealing. Forecasting guru Nate Silver has a good description of how noise looks like signal. For example, with the tens of thousands of economic statistics available to build a forecasting model, finding a pattern after the fact is deceptively easy. But it usually doesn’t work for predicting future economic trends.
Another caution comes from genomic studies. In a study of, say, cancer genetics, statisticians may conduct millions of tests for the association between any genetic variant and the occurrence of cancer. With the typical definition of “statistical significance” – which tolerates a 5 percent random chance of being wrong – that means they’d find hundreds of thousands of bogus “significant” associations. So good scientists set their significance threshold for such studies much tighter, more like.00005 percent than 5 percent. That way they are sure to only blow the whistle on genes if the chances of being wrong are vanishingly small.
So, this is a suggestive game of Big-Data Craps, not real research. It’s meant to provoke a little. I hope we’ll think creatively about new kinds of data we can use. Also, I want to generate ideas about cultural explanations for demographic trends. It should be at least as useful as some pundit simply declaring, for example, that gay marriage is killing real marriage. (“As the cause of gay marriage has pressed forward,” wrote Ross Douthat, “the social link between marriage and childbearing has indeed weakened faster than before.” That theory has about as much going for it as one linking the decline of marriage to the rise of high fructose corn syrup or the explosion of red cards in World Cup soccer.)
Kanye’s fantasy
With those caveats, here are three possible explanations for the finding:
- Google, by trawling through millions of search term patterns, has come up with a random bit of noise that just happened to catch my attention. There’s nothing there, really.
- The hip-hop Google search is capturing a more finely-grained demographic pattern than I did with my simple Census numbers. So what matters for marriage is not just things like the percentage female, education levels and racial composition of the population, but the presence of particular combinations of these demographic groups. Hip hop’s audience is notoriously difficult to define — it’s featured on top-five radio stations in markets such as San Francisco and Los Angeles as well as Detroit and Atlanta — but it’s certainly not as simple as age, gender, and race
- Hip-hop actually is weakening marriage in America. People who listen to Kanye West and other hip-hop music are taken in by the music’s consumerist individualism and shun marriage, with its staid image of tradition, conformity and restraint. As a result, they are less likely to get married than the people Googling “rolls recipe.”
I lean toward explanation #2. Explanation #3 might have something to it. As the philosopher xkcd wrote, “correlation does not imply causation, but it does waggle its eyebrows suggestively and gesture furtively while mouthing ‘look over there.’” But I wouldn’t draw that conclusion without a lot more evidence, including doing some comparisons to other cultural factors, like other kinds of music or religious patterns. Since I have no expertise in hip hop (post 1989), I would be glad to hear from people who know about it for realz.
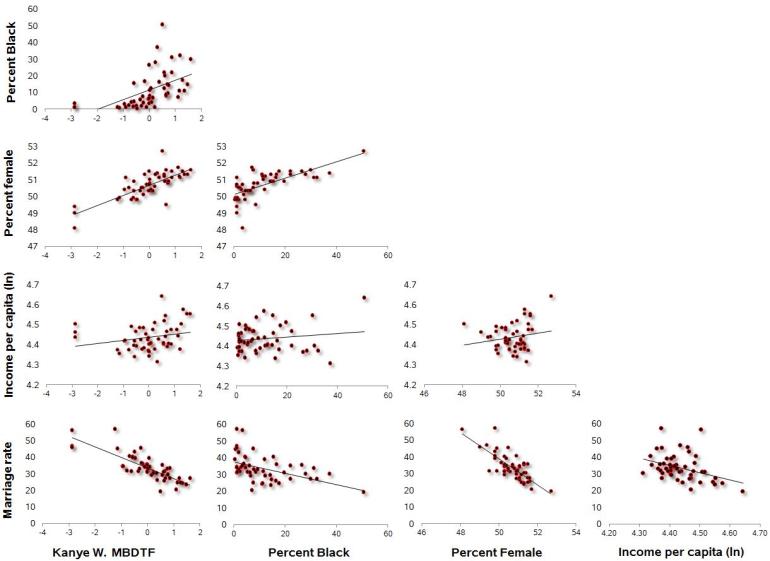
Addendum: Here’s a scattergram showing the correlations between some of the variables in the regression. In each cell there’s a dot for every state plus DC. The Kanye variable is scaled (by Google) to have a mean of 0 and standard deviation of 1 (click to enlarge).


Philip, as always, an interesting analysis using the Google tools. I keep thinking about how we can use these tools in a better way, particularly when it comes to the tendency to cherry-pick results because of the way Google presents the information to us. I worry about the high correlation between certain demographic characteristics and the search results … similar to your #2 explanation at the bottom. Searches for “college application” are pretty good at predicting fall 1st time freshman enrollment. Searches for “college loan(s)” are not. These things keep me up at night…
LikeLike
It strikes me that your analysis should consider the fact that marriage is already way down. So variations on who is marrying happens in a context, specifically, of people resisting a social trend. Maybe hip-hop listeners are, so to speak, more conventional — people choosing to “fit in” with the contemporary culture which expects them to remain single — at least in certain life circumstances.
LikeLike