Note: Technical addendum added.
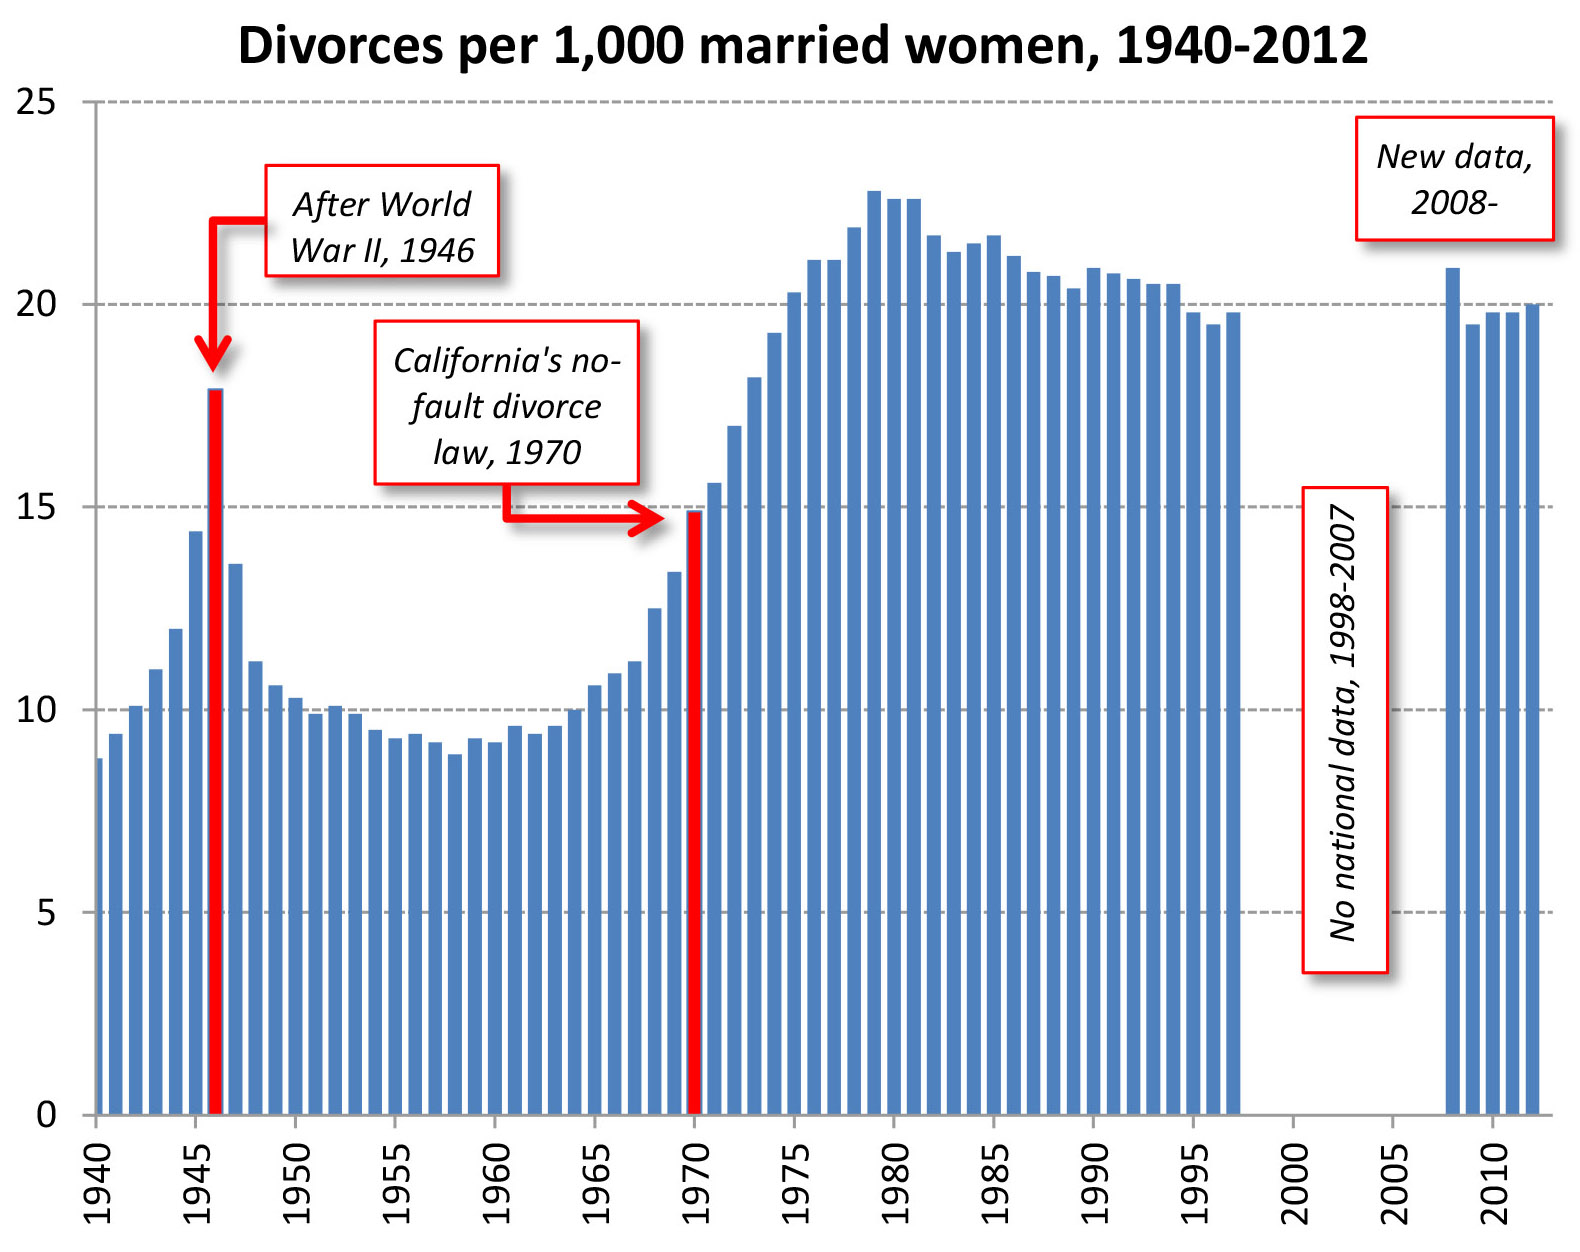
The Census Bureau’s American Community Survey is the best annual national data source for marital events. The 2012 data came out recently, and I don’t believe anyone else has published a divorce rate for 2012. The refined divorce rate – the number of divorces per 1,000 married people – was 19.0 in 2012. Here is the trend since the ACS starting counting divorces:

What does this mean? It’s a shame the ACS didn’t start counting marital events till 2008, because it means we can’t put that year’s high rate in context. Was it (a) a spike up, suggesting divorce was a leading indicator for the recession; (b) part of a consistent decline, suggesting the the years since have been a pretty substantial increase from the historical trend; or, (c) a data anomaly.*
To put this in the context of the larger trend doesn’t really help answer the question, since we switched from vital records to a national survey, and had a decade with no national statistics in between:
So, it’s a mystery. My preferred interpretation is still that the recession caused a decline in divorces because disgruntled people were tied up in other crises, couldn’t sell their houses, or couldn’t afford to move out, followed by a rebound of accumulated divorces to our current level.
I published a working paper suggesting this [now forthcoming in Population Research and Policy Review], in which I use 2008 predictors of divorce and estimate that 4% fewer divorces occurred through 2011 compared to what would have been expected had the determinants of divorce not changed in the subsequent years.
My blog series on divorce includes previous reports on rates, and attempts to predict divorce rates using Google searches.
Technical addendum
To replicate my rates for 2012, you start here at the FactFinder, then get the number of married people by sex (ACS Table B12001) and the number of people who got divorced in the 12 months before the survey (ACS Table S1251) — you can enter the table numbers into the search box. There is a slight problem with this, however. Some people who say they got divorced in the past 12 months also say they are currently married (presumably remarried already). Those people are counted twice in the denominator of the FactFinder-based divorce rate — once as divorced people and once as currently married. If you download the public-use file and count those people only once in the denominator, the divorce rate rises by .02 per 1,000 (or 2 people per 100,000) — but this would not change the figures above at the level of precision reported. However, the public-use files produce slightly different estimates than the FactFinder files anyway, because the latter are based on the Census Bureau’s complete file not a subsample, so I use those even though they produce this tiny under-estimate of the divorce rate.
Secondly, what about the difference in divorce rates between men and women? This is a survey, not a vital records count, and there is no way to verify with the now-missing spouses whether they also consider themselves divorced. Maybe they weren’t legally married, or they didn’t really get legally divorced. So there are several possibilities: (a) lots of lesbian divorces, which is unlikely given the small number of lesbian marriages (but note we don’t know the sex of the spouse who is no longer in the household so we can’t distinguish homogamous from heterogamous divorces); (b) women are more likely to describe a breakup as a divorce for reasons unknown; (c) something funky with the survey weights (unweighted divorce rates from the public-use file also show the disparity, but it’s 20% smaller), or; (d) something funky with the sampling.
Who knows! If you are reading this and considering a new career — or a new direction in your existing career — consider becoming a family demographer and helping us figure it out.


It is interesting that it dipped the year that unemployment peaked (2009), which would support your idea about people not divorcing during crises. Since men’s unemployment was particularly high during the recession, I wonder if, despite the still prevalent male breadwinner role, women don’t divorce men when they lose their job during a recession.
LikeLike
Separately, why is the California no fault divorce considered to be a landmark? The divorce rate increased from 8 in 1960 almost linearly to 22 in 1976.
LikeLike
I’m just showing when it happened, partly to underscore the point you are making.
LikeLike
I am not questioning you, just trying to understand. Also, why it started declining in 1981? Why has it been flat since 1989? I just dont understand divorce in America.
LikeLike
I don’t find the differenced in male and female reporting rates that surprising. The majority of divorces are initiated by women, suggesting that they are much more likely to see the relationship as “over” sooner. Men might wait until papers are served and signed. So a woman who considered herself divorced in 2008 might have been married to man who didn’t consider himself divorced until 2010. There has been some convergence, at least, over time, which is what you would expect.
LikeLike
I have a little quibble about the entire article. Statistically 20.9 is not significantly different from 20. I can only conclude that the divorce rates have flatlined since 1986. I would love an explanation for that, not the +/- 1 differences.
LikeLike
The methods from the two periods are not comparable, so the fact that the numbers are similar is not very informative. Counting divorce decrees is quite different from surveying the population. The trends are useful when the methods don’t change, but a change in methods with a big time gap prohibits direct comparison.
LikeLike
Is this sentence incorrect?
“Divorce rates have not changed substantally (+/- 1%) since the mod 1980s and have not been significantly impacted by economics”
LikeLike
I can think of a couple more possible reasons for the difference in reported divorces.
First, people aren’t always very accurate at reporting when events occurred and their accuracy may vary by gender (for example, Skowronski and Thompson (1990) and Auriat (1993)). If men telescope backwards (perceive the divorce as more distant) and/or women telescope forwards (perceive the divorce as more recent) – it could lead to the observed difference in number of reported divorces in the past 12 months.
Second, it could result from different patterns in remarriage. Since the question is whether or not an individual got divorced in the past 12 months, it’s feasible that some people got divorced twice but are only being counted as one divorce each. For example, if a different-sex couple divorced and the man remarried another woman and divorced again all in the span of the previous twelve months, this would result in one male and two female divorces. But, this seems unlikely to be common enough to drive the difference in divorce rates.
Third, its looks like the question about being divorced in the past 12 months was asked to those who were ever married. If you’re not asked the question, you will not be counted as divorced. There are a lot more ever-married women than men (both because there are more women alive and because a higher proportion are ever married). Some people who are asked the question may accidentally answer “yes”, even if they weren’t divorced in the past 12 months. If there is some small proportion of both men and women who accidentally answer “yes,” by asking more women if they have ever been divorced, the question could result in more total “yes” answers (combining the correct and incorrect “yes” answers) from women than from men. So, this could cause the different numbers of divorce.
Just some other ideas!
LikeLike