It would be great to know more about everything, but if you ask just these five questions of enough people, you can learn an awful lot about marriage and divorce.
Questions
First the questions, then some data. These are the question wordings from the 2013 American Community Survey (ACS).
1. What is Person X’s age?
We’ll just take the people who are ages 15 to 59, but that’s optional.
2. What is this person’s marital status?
Surprisingly, we don’t want to know if they’re divorced, just if they’re currently married (I include people are are separated and those who live apart from their spouses for other reasons). This is the denominator in your basic “refined divorce rate,” or divorces per 1000 married people.
3. In the past 12 months, did this person get divorced?
The number of people who got divorced in the last year is the numerator in your refined divorce rate. According to the ACS in 2013 (using population weights to scale the estimates up to the whole population), there were 127,571,069 married people, and 2,268,373 of them got divorced, so the refined divorce rate was 17.8 per 1,000 married people. When I analyze who got divorced, I’m going to mix all the currently-married and just-divorced people together, and then treat the divorces as an event, asking, who just got divorced?
4. In what year did this person last get married?
This is crucial for estimating divorce rates according to marriage duration. When you subtract this from the current year, that’s how long they are (or were) married. When you subtract the marriage duration from age, you get the age at marriage. (For example, a person who is 40 years old in 2013, who last got married in 2003, has a marriage duration of 10 years, and an age at marriage of 30.)
5. How many times has this person been married?
I use this to narrow our analysis down to women in their first marriages, which is a conventional way of simplifying the analysis, but that’s optional.
Data
I restrict the analysis below to women, which is just a sexist convention for simplifying things (since men and women do things at different ages).*
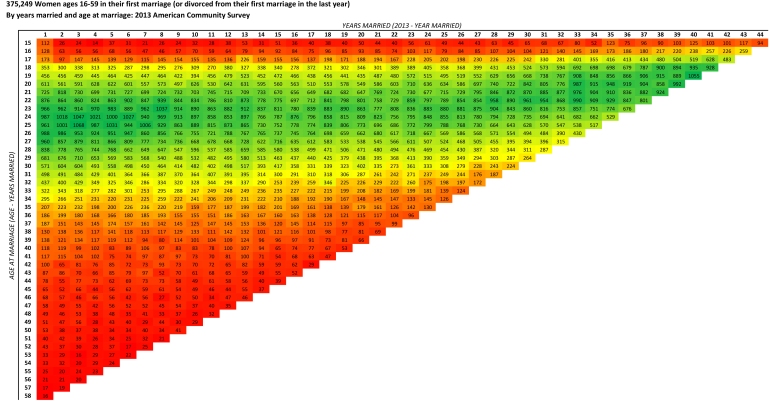
So here are the 375,249 women in the 2013 ACS public use file, ages 16-59, who were in their first marriages, or just divorced from their first marriages, by their age at marriage and marriage duration. Add the two numbers together and you get their current age. The colors let you see the basic distribution (click to enlarge):
The most populous cell on the table is 28-year-olds who got married three years ago, at age 25, with 1068 people. The least populous is 19-year-olds who got married at 15 (just 14 of them). The diagonal edge reflects my arbitrary cutoff at age 59.
Divorce results
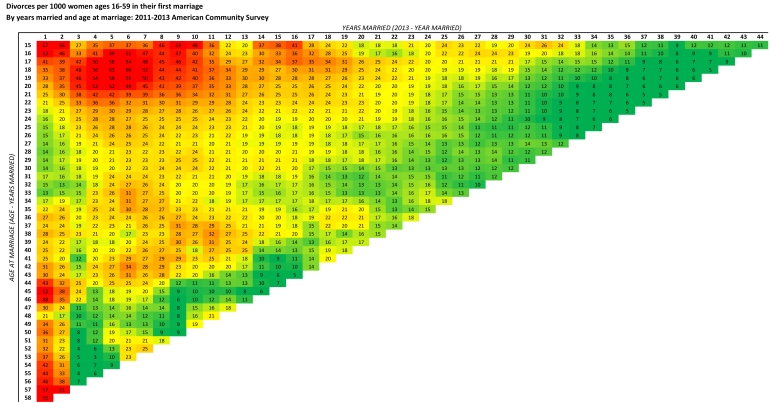
Now, in each of these cells there are married people, and (in most of them) people who just got divorced. The ratio between those two frequencies is a divorce rate — one specific to the age at marriage and marriage duration. To make the next figure I used three years of ACS data (2011-2013) so the results would be smoother. (And then I smoothed it more by replacing each cell with an average of itself and the adjoining cells.) These are the divorce rates by age at marriage and years married (click to enlarge):
The overall pattern here is more green, or lower divorce rates, to the right (longer duration of marriage) and down (older age at marriage). So the big red patch is the first 12 years for marriages begun before the woman was age 25. And after about 25 years of marriage it’s pretty much green, for low divorce rates. The high contrast at the bottom left implies an interesting high risk but steep decline in the first few years after marriage for these late marriages. This matrix adds nuance to the pattern I reported the other day, which featured a little bump up in divorce odds for people who married in their late thirties. From this figure it looks like marriages that start after the woman is about 35 might have less of a honeymoon period than those beginning about age 24-33.
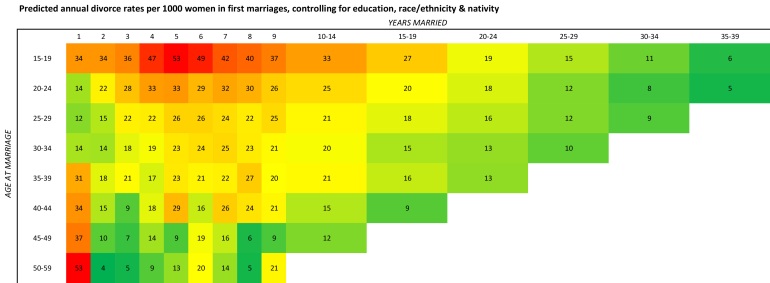
To learn more, I go beyond those five great questions, and use a regression model (same as the other day), with a (collapsed) marriage-age–by–marriage-duration matrix. So these are predicted divorce rates per 1000, holding education, race/ethnicity, and nativity constant (click to enlarge)**:
The controls cut down the late-thirties bump and isolate it mostly to the first year. This also shows that the punishing first year is an issue for all ages over 35. The late thirties just showed the bump because that group doesn’t have the big drop in divorce after the first year that the later years do. Interesting!
Sigh
Here’s where the awesome data let us down. This data is very powerful. It’s the best contemporary big data set we have for analyzing divorce. It has taken us this far, but it can’t explain a pattern like this.
We can control for education, but that’s just the education level at the time of the most recent survey. We can’t know when she got her education relative to the dates of her marriage. Further, from the ACS we can’t tell how many children a person has had, with whom, and when — we only know about children who happen to be living in the household in 2013, so a 50-year-old could be childfree or have raised and released four kids already. And about couples, although we can say things about the other spouse from looking around in the household (such as his age, race, and income), if someone has divorced the spouse is gone and there is no information about that person (even their sex). So we can’t use that information to build a model of divorce predictors.
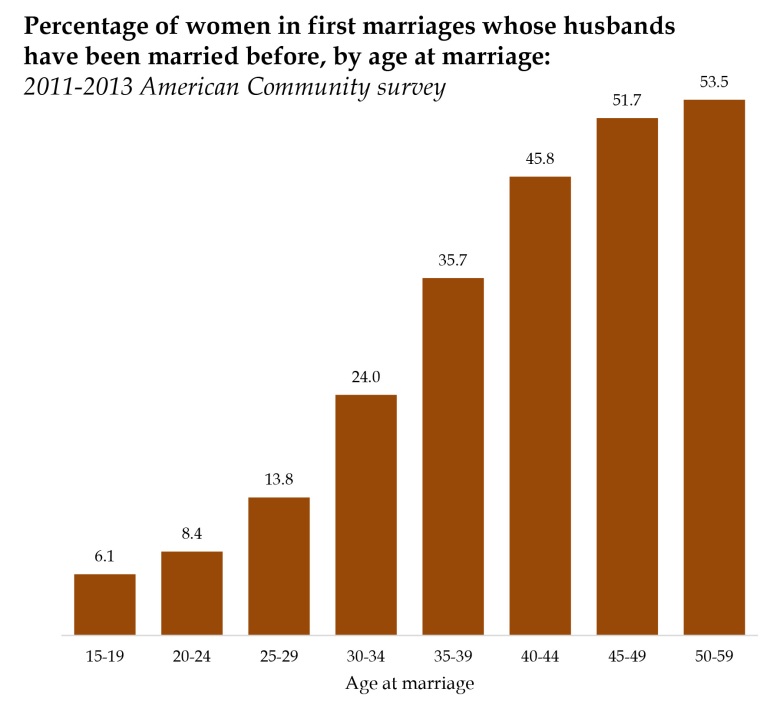
Here’s an example of what we can only hint at. Remarriages are more likely to end in divorce, for a variety of reasons, which is why we simplify these things by only looking at first marriages. But what about the spouse? Some of these women are married to men who’ve been married before. I can’t how much that contributes to their likelihood of divorce, but it almost certainly does. Think about the bump up in the divorce rate for women who got married in their late thirties. On the way from high divorce rates for women who marry early to low rates for women who marry late, the overall downward slope reflects increasing maturity and independence for women, but it’s running against the pressure of their increasingly complicated relationship situations. That late-thirties bump may have to do with the likelihood that their husbands have been married before. Here’s the circumstantial evidence:
See that big jump from early-thirties to late-thirties? All of a sudden 37.5% of women marrying in their late-thirties are marrying men who are remarrying. That’s a substantial risk factor for divorce, and one I can’t account for in my analysis (because we don’t have spouse information for divorced women).
On method
Divorce is complicated and inherently longitudinal. Marriages arise out of specific contexts and thrive or decay in many different ways. Yesterday’s crucial influence may disappear today. So how can we say anything about divorce using a single, cross-sectional survey sample? The unsatisfying answer is that all analysis is partial. But these five questions give us a lot to go on, because knowing when a person got married allows us to develop a multidimensional image of the events, as I’ve demonstrated here.
But, you ask, what can we learn from, say, the divorce propensity of today’s 40-year-olds when we know that just last year a whole bunch of 39-year-olds divorced, skewing today’s sample? This is a real issue. And demography provides an answer that is at once partial and powerful: Simple, we use today’s 39-year-olds, too. In the purest form, this approach gives us the life table, in which one year’s mortality rates — at every age — lead to a projection of life expectancy. Another common application is the total fertility rate (watch the video!), which sums birth rates by age to project total births for a generation. In this case I have not produced a complete divorce life table (which I promised a while ago — it’s coming). But the approach is similar.
These are all synthetic cohort approaches (described nicely in the Week 6 lecture slides from this excellent Steven Ruggles course). In this case, the cohorts are age-at-marriage groups. Look at the table above and follow the row for, say, marriages that started at age 28, to see that synthetic cohort’s divorce experience from marriage until age 59. It’s neither a perfect depiction of the past, nor a foolproof prediction of the future. Rather, it tells us what’s happening now in cohort terms that are readily interpretable.
Conclusion
The ACS is the best thing we have for understanding the basic contours of divorce trends and patterns. Those five questions are invaluable.
* For this I also tossed the people who were reported to have married in the current year, because I wasn’t sure about the timing of their marriages and divorces, but I put them back in for the regressions.
** The codebook for my IPUMS data extraction is here, my Stata code is here. The heat-map model here isn’t in that code file, but this these are the commands (and the margins command took a very long time, so please don’t tell me there’s something wrong with it):
logistic divorce i.agemarc#i.mardurc i.degree i.race i.hispan i.citizen
margins i.agemarc#i.mardurc


I really liked the charts, they were easy to understand and I liked having the full detail charts and then the collapsed charts, really nice.
I tell you what I thought was the most interesting and that was showing at what age you married, what was going to be your toughest relationship years(s).
For example if you married at 20 years old it shows that you can have a difficult marital relationship for the first [14 tough years] starting right off in the first year, but if you make it past the first 14 years life gets better and better.
Age 27 looks like the best only [3 tough years] to get through, years 5, 6, & 7. (The seven year itch, lol!) and then it looks pretty good.
If you married at age 28 you get a honeymoon period, but then take extra care in your relationship in years 6,7,8,9, & 10 (the seven year itch, lol!) if you can hang together through those years life gets better and better. [5 tough years]
Ages 31 & 32 look pretty good, it looks like you only have to make it through [4 tough years], years 5, 6, 7 & 8.
Ages 33 – 36 look hard.
It’s interesting that at age 45 if you can get over the awful first 2 years then you have a very good chance of succeeding.
I think having children are hard on a marriage, there is always the disagreements on who picks them up from daycare, who has to run out for emergency diapers etc. “You do the dishes I have to give the baby a bath.” People who get married at 20 are more likely to have children at a younger age as as well I would think, so you see this as having more troubles and longer in their early married life. Money (lack of) is always an issue to younger people that is an added conflict point for people who marry young.
Likewise people who marry later, age 27, by age 32 (5 years later) most of them have children, that is where you see the trouble years start but not as bad at the people who married at age 20 (red). Probably you are making more money so the lack of money issue the twenty year olds have the 27 year olds (orange) do not have.
Children are a joy in our lives, but they also can be very stressful on a relationship.
So I wonder what accounts for the trouble right from the get go of the people married in their late 30’s and beyond? Step families, ex-wives? Just being set in your ways and difficult to adjust?
I have always remembered something I read about what makes a success marriage and that is this, “A successful marriage means you have to give in sometimes when you KNOW you are right.”
I’ll never forget my husband backing the car down the driveway with a camper on the trailer hitch, the mailbox was on my side.
“Turn the wheel the other way you’re going to hit the mailbox.”
He pulls the car forward and retries, “Turn the wheel the other way your going to hit the mailbox.”
He pulls the car forward & tries it again, “Turn the wheel the other way you are going to hit the mailbox.”
Irritated, “No I’m NOT, will you please be quiet I know what I am doing!”
30 seconds later we hit the mailbox but I did as I was asked and stayed quiet even though I could see *we were going to hit the mailbox*. I gave in when I was right, I knew we were going to hit the mailbox but this was not a huge huge issue where anybody would have gotten injured so I just stayed quiet and let him hit the mailbox because to continue telling him was just going to blow up into a big fight. He had to do it himself and I stayed quiet and let him do it, then I controlled myself and wasn’t smug when in fact he hit the mailbox. He knew I was right & he screwed up, I didn’t have to be all over him, it was only a mailbox post that he resank after the trip. (by the way from then on I always backed the car+camper down the driveway & I let him tell me which way to turn the wheel and did it. He didn’t want to back the car down the driveway any more after the mailbox incident.)
This is the key to a good marriage I think, compromising *when you know you are right*. Also not having it out on the first round, sometimes when you can’t agree on something, say a major purchase you, agree to let it perk for a while, and to each think about it longer and come back to it. Everything doesn’t have to be decided in only one discussion when you are miles apart in your thinking.
I really liked the data I studied it for quite a long time, again the charts were excellent and it lead me to thinking about the “whys” behind the data. To speculate, why are the year brackets easier or harder depending upon the age you married? Why is that?
LikeLiked by 1 person
There are studies that show a decline in marital satisfaction after the birth of children (Twenge has the best review)
LikeLike
I loved your example. I have a theory that backing up trailers, boats, and 5th wheels cause divorce. (Along with remodeling your home.)
LikeLike
Very helpful in many ways…personally and professionally. Thank you. Two things come to mind: 1) Using only female data will be impossible in future renditions, for obvious reasons. 2) This is very useful in demonstrating how the overall divorce rate estimates of 50% (ish) is attributable to high numbers of 15-19 year olds either being love struck and/or rushed into marriage through unplanned pregnancies, likely. This will be sound evidence for those advocating for greater access to family planning choices. Thank you for that!
LikeLiked by 1 person
This is a great analysis for large data sets. And it’s important that you acknowledged that you can’t really make longitudinaI inferences from cross-sectional data (only a few people pay attention to this). Finally, know, that you’re a Sociologist and I’m a psychologist, but don’t you think that the study of divorce also requires some information from both partners about the quality of their relationship? I don’t think that people actually divorce and separate because they are in a high demographic risk category.
LikeLike
Thanks. Of course if you want to know why people divorce you have to study their relationships. (You could say divorce is itself a measure of relationship quality – but a very blunt one!)
LikeLike
Because marital quality is correlated with class, you can’t assume that it’s a proxy. That is, not all couples in the same social/economic class have the same level of satisfaction. In fact the range within class is large.
Also, it’s very risky to use population risk data to advise individuals. Even if the risk for the 21 year old is higher than the risk for a 26 year old, the prediction is VERY far from perfect. Again, you’d need to know a lot more about the woman and the couple. I’m not claiming that psychologists can give perfect advice to individuals, but sociologists and others using demographic data will only do well on the average, not with a specific couple. My point here is really that you need both large group and individual qualitative data to make sense of divorce and other couple phenomena.
LikeLike
Right. The problem is that satisfied couples generally stay married, but unhappy couples often stay together (for economic reasons, for the sake of the children etc.)
LikeLike
to Phil C. with the W, even qualitative studies reveal how marital satisfaction and quality are a proxy of class, which is an ancillary characteristic of educational attainment, and Phil C without the W mentions that as a limitation in this data. People don’t divorce because they are in a high risk category, but after looking at that descriptive data, would you advise a 21 year old woman to wait until she is 26 or so to get married? Seems logical.
LikeLike
PT,
You asked the question every parent raising teenagers wants to know: “How do we apply this to ourselves, our friends, and our children?”
On a personal face-to-face basis, I don’t think we can, except to discuss generalities.
On a public policy basis, I think it’s clear we need to reduce the barriers to getting a good education and higher income jobs.
The reason we can’t apply it personally is that there’s the Personality Factor that cannot be measured easily. It’s the mental health, flexibility, and tenacity of the individuals.
For my first marriage, Big Data showed an incredibly low divorce risk. No one with a spreadsheet would have warned me: After all, we were over age 24, no generalized anxiety disorder, we dated more than 2 years, weekly churchgoers, 4-year college degrees, high incomes, my parents are still together.
Yet I was married to a very clever pedophile who knew just what to say to make me believe he was already getting help and was no longer a danger.
No one wants to go back to the eugenics of the 1920s-1930s when governments gave people certificates of physical and emotional health prior to marriage. Most states don’t even require blood tests anymore.
So it’s Buyer Beware. Marriage is —and will always be—a risk, and there’s nothing anyone can do to reduce that risk to zero.
LikeLike
Interesting studies
LikeLike
Really interesting take on the data. I don’t think I’ve seen data on divorce assembled like that.
LikeLike