Don’t drive distracted, okay? Now for some more updated facts. (Follow the whole series under the texting tag.)
The Diane Rehm show on NPR (Washington station WAMU) did another full episode on the perils of distracted driving. The extremely misleading title of the episode was, “Distracted Driving: What It Will Take To Lower Fatalities.”
The guests were researcher David Strayer; Jeff Larason, director of highway safety for Massachusetts; Joan Claybrook, former administrator of the National Highway Traffic Safety Administration; and Ben Leiberman, the co-founder of Distracted Operators Risk Casualties (DORCs), which is trying to develop the technology (and legislation) to allow police to scan phones at the scene of an accident to determine whether they were being used at the time of the crash.
I am pretty sure that every one of these guests knows that our roads are safer now than they have ever been, and that accident and fatality rates are at historic lows. And yet the entire conversation — without explicitly stating any trend facts — was conducted as if it is self-apparent that the problem is getting worse and worse. Several callers said they see more and more drivers on their phones; someone said one-in-four drivers is using a phone; someone said texting and driving is as dangerous as driving drunk. Maybe more and more people are using their phones while they drive, but that’s not making the roads less safe than they used to be.
Why can’t they handle the truth? Texting and other distractions are dangerous, and people shouldn’t do them — and the roads are getting safer over time. Here are the fatality trends for the last 20 years, from NHTSA:

In the last 20 years, fatalities per mile have fallen 38% and fatalities per person have fallen 34%. That doesn’t make texting and driving okay, okay? But it’s true.
Further, much was made in the conversation about the special risks posed by younger drivers, who are said to be less skilled and more distractable behind the wheel. This also highly misleading. A separate data series, maintained by the Insurance Institute for Highway Safety, has fatal accidents by the age of the driver going back to 1975. This shows that the steepest decline in fatal accidents has been among teenage drivers — a stunning 71% decline in fatal accidents per person in that age group since the peak in 1978. In fact, teen drivers are now involved in fewer fatal accidents per person than 20-34-year-olds:

I can understand that for advocates a story of continuously increasing peril is attractive. That doesn’t justify their refusal to speak facts, but it’s at least predictable. The guests all spoke of the need for more money to be devoted to the problem, more legislation, more awareness — all things that (no offense) pay their personal and professional bills.*
Less forgivable are the journalists who refuse to look seriously at the issue even as they devote inordinate amounts of time to it. This is a serious disservice, because the media-consuming public may want to seriously consider how to allocate resources to address different problems. Call me crazy, but knowing the facts seems important for this process. And in this case it’s not just that the facts are a little out of line with the narrative — they absolutely and dramatically contradict it.
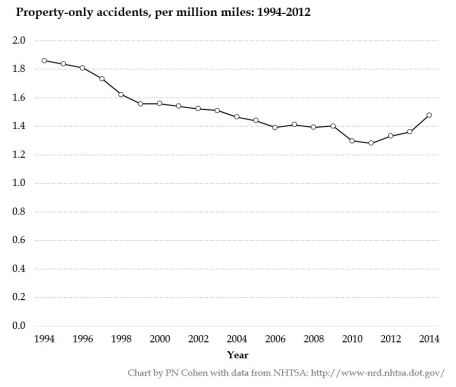
Now for the fact you think I would be reluctant to mention: for the first time in two decades, the rate of property-damage-only accidents has increased for three years in a row. This may be a better measure of accident risk, because the fatality numbers could be partly driven by things like improved medical response time or auto safety devices. Still, property-only accidents per mile are down 21% since 1994 (while mobile phone subscriptions have risen more than 1200%).
That is an interesting turnaround, worth looking into. Unfortunately, I don’t have much confidence in the current crop of experts to offer a credible explanation for it.
* It’s no more surprising than academic professional association staff defending journal paywalls.


Perhaps property only accident reporting climbed in response to some insurance companies advertising accident forgiveness in recent years?
LikeLiked by 1 person
The comparison shown in Figure 3 is not appropriate beyond 2010. See note under each table in NHTSA traffic safety facts 2012 [1] or 2014[2] as:
“Notes: Some States include restricted driver licenses and graduated driver licenses in their licensed driver counts. Due to an enhancement in the registration data provided by R.L. Polk & Co. for 2011 and 2012, registration counts for those years changed considerably from the counts provided for 2010 and earlier years. This should be taken into account when comparing registration numbers and rates per registered vehicle for 2010 and earlier years with those for 2011 and later years. For more details, see “Changes from the Traffic Safety Facts 2011 Report” on page 8.”
The turnaround in 2010 is caused by the change in the way R.L.Polk calculated driver numbers and rates of accidents in 2011-2014.
1. “TRAFFIC SAFETY FACTS 2012,
Click to access 812032.pdf
2. “TRAFFIC SAFETY FACTS 2014
http://www-nrd.nhtsa.dot.gov/Pubs/812261.pdf,
LikeLike
The results shown in Figure 3 cannot be used to compare pre-2010 data with psot-2010 data owing to changes in calculations of registered drivers. See footnote at the bottom of tables in “TRAFFIC SAFETY FACTS 2014” http://www-nrd.nhtsa.dot.gov/Pubs/812261.pdf
“Notes: Some States include restricted driver licenses and graduated driver licenses in their licensed driver counts. Due to an enhancement in the registration data provided by R.L. Polk & Co. for 2011 and later years, registration counts for those years changed considerably from the counts provided for 2010 and earlier years. This should be taken into account when comparing registration numbers and rates per registered vehicle for 2010 and earlier years with those for 2011 and later years. For more details, see “Changes from the Traffic Safety Facts 2013 Report” on page 8.”
The data on registered passenger vehicles and vehicle-miles went goofy between 2007-2010 and 2011-2014 in Page 9 of Traffic safety facts 2014. Total number of vehicles increased 6% between 2009 and 2014 but vehicle-miles increased only 2%. Independent of all this, the property damage accidents exploded in 2014 as the Table below shows:
2007 6,024,000
2008 5,811,000
2009 5,505,000
2010 5,419,000
2011 5,338,000
2012 5,615,000
2013 5,687,000
2014 6,064,000
An that is worrisome, but cannot be readily correlate to cell phone usage.
LikeLike
Thanks. I’m not sure that matters for my chart because I didn’t use registered vehicle numbers, just miles driven (though don’t know how they estimate that).
LikeLike
Vehicle miles is derived off registered vehicles using 12,000 for passenger cars and so on. BUT, the increase in 2011-2014 in property damage is alarming, but, no one has related that to cell phone use.
LikeLike
In response to : “Maybe more and more people are using their phones while they drive, but that’s not making the roads less safe than they used to be.”
There is a good chance that texting is making our roads less safe, it just is not showing up in aggregate trends. Maybe we should not be as worried about texting and driving as the NPR guests claim. However, as far as I know, you are the one who brought aggregate trends into the arguement. I think it is misleading to even look at these graphs as evidence (beyond a cursory correlation) either for or against texting.
LikeLike
They (NHTSA) are not using data to argue their position, why should the professor bring data to argue their position? It is like bringing a gun to a fistfight.
Henceforth all arguments should be settled without data, and jsust based on what I believe in.
LikeLike
I would rather see no data, than data used in an incorrect or misleading way.
LikeLike
My model for Figure 3 is “the act of texting/speaking/browsing requires the driver to slow down considerably, and hence most cell phone-driven accidents involve just property (auto/wall/utility post) damage; additionally, the drivers are not sufficiently impaired to recover from wrong decisions to just nudge or hit poles, and avoid direct collisions at high speed”.
Unfortunately, references 1,2,3 do not even provide proof for the fact that increased property damage is caused by cell/text.
–Lack of increased crash\near-crash risk associated with ‘just
talking’ on a phone in naturalistic studies (e.g., Farmer et al,
2014a; Fitch et al 2013)
–Drivers tend to look out the front windshield and at the mirrors
more when ‘just talking’ (e.g., Farmer et al. 2014b)
Read the tables in pages 14-19 in “http://www.nsc.org/DistractedDrivingDocuments/Cognitive-Distraction-White-Paper.pdf”
or Google cognitive distraction.
1. Farmer et al. (2014a). Relationship of near-crash/crash risk to time spent on a cell phone while driving. IIHS, Arlington, VA.
2. Farmer et al. (2014b). Secondary behavior of drivers on cell phones. IIHS, Arlington, VA.
3. Fitch et al. (2013). The impact of hand-held and hands-free cell phone use on driving performance and safety-critical event risk. DOT HS 811-757. NHTSA, Washington, DC
LikeLike
“Shut up and follow the narrative. If you don’t, we’ll stop funding you.”
LikeLike
Alway appreciate your analysis. I suspect, like so many other things that individuals get super worked up about, it is easier to shame bad behavior and pass feel good legislation for this than for so many other pressing needs. Bleh.
LikeLike