At the 1900 Paris Exposition, sociologist W. E. B. Du Bois presented some the work of his students. In The Scholar Denied: W. E. B. Du Bois and the Birth of Modern Sociology, Aldon Morris writes:
Du Bois’s meticulousness as a teacher is apparent in the charts and graphs that he prepared with his students. For example, as part of his gold medal-winning exhibit for the 1900 Paris Exposition, Du Bois and his students produced detailed hand-drawn artistically colored graphs and charts that depicted the journey of black Georgians from slavery to freedom.
Some of collection is shown in this post at the Public Domain Review (shared by Tressie McMillan Cottom yesterday); the full collection is online at the Library of Congress (LOC).
The one that caught my eye was this, showing marital status (“conjugal condition”) by age and sex for the Black population. I can’t find the source details in the LOC record, so I don’t know if it’s Georgia or national, but I presume it’s from tabulations of 1890 decennial census or earlier:
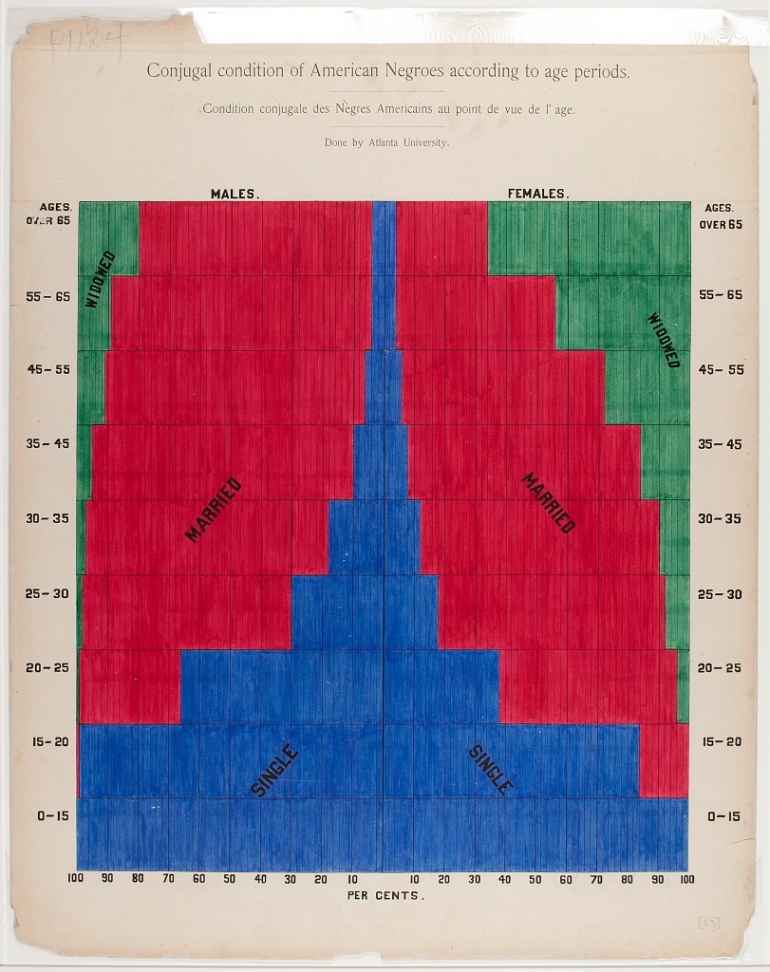
It’s artistic and meticulous and clearly informative, beautiful. So I tried to make a 2015 update to complement it. I used data from the 2015 American Community Survey via IPUMS.org, and did it a little differently.* Most importantly, I added two more conjugal conditions, cohabiting and separated/divorced. Second, I used five-year age groupings all the way up, instead of ten. Third, I detailed the age groups up to age 85. Here’s what I got:
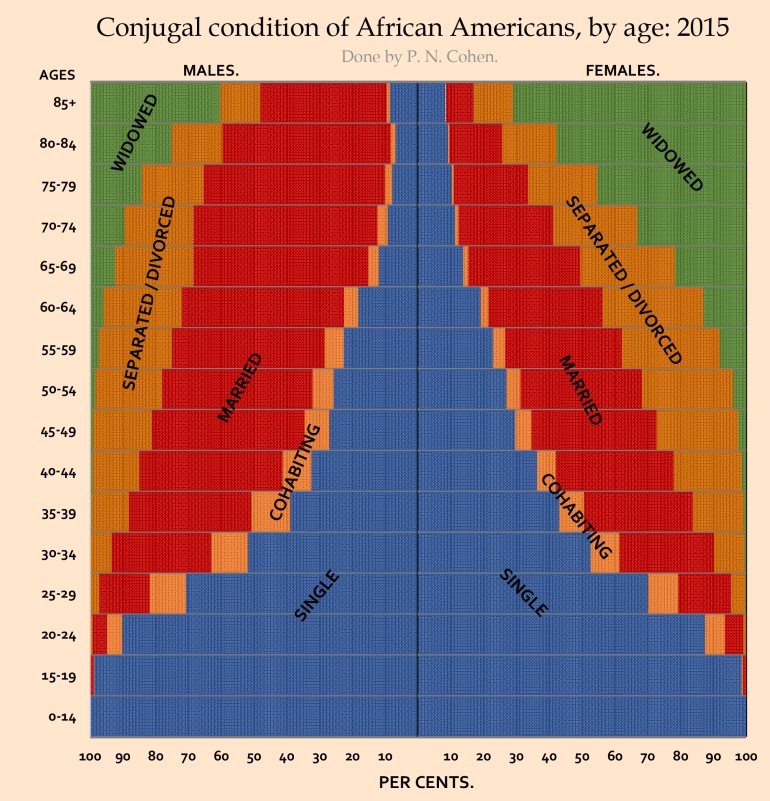
Some very big differences: Much smaller proportions of African Americans married now. Also, much later marriage. In the 1900 figure more than 30% of men and 60% of women have been married by age 25; those numbers are 5-6% now. I don’t know how they counted separated/divorced people in 1900, but those numbers are high now at 31% for women and 24% for men at age 60-64. Widowhood is later now, as 42% of women were widowed before age 65 in 1900, compared with only 13% now (of course, that’s off a lower marriage rate, and remarried people are just counted as married). And of course cohabitation, which the chart doesn’t show for 1900. Note I included people in same-sex as well as different-sex couples.
So, thanks for indulging me. I hope you don’t think it’s frivolous. I just love staring at the old charts, and going through the (very different) steps of replicating it was really satisfying. (I also just love that in another 100 years someone might look back on this and say, “Wait, which one was Earth again?”)
Note: If you want to compare them side-by-side, here’s a go at that. The age ranges don’t line up perfectly but you can get the idea (click to enlarge):

* SAS code, ACS data, images, and the spreadsheet used for this post are shared as an Open Science Framework project, here.


very well done
LikeLiked by 1 person
Yes, very well done — the stories in those statistics are fascinating. I love looking at the ways DuBois presented data graphically — I think you did a nice job echoing the aesthetic here. Did you clock how long it took you to make it look that way? I’m teaching a sociology of community class and we’ve been looking at some of the maps and charts related to “Philadelphia Negro” and they too are striking in their combined simplicity and complexity.
And did you use SAS just for throwback Thursday purposes?
LikeLike
Thanks. Didn’t take too long because I already had the marital status (+cohab) code, and the figure is basically a population pyramid, which I had an excel model of. Helped to choose a figure that’s very close to what excel is ready to do.
I only used SAS because of the cohab thing – you have to attach cohabiting partners (related=1114) to householders, so it’s a first.id sort-by-retain situation which I don’t know how to handle in Stata.
LikeLike
Do you know why the left and the right (male and female) married numbers are persistently unbalanced over all age groups in both DuBois’s and your data set? One would expect they should be consistently balanced.
LikeLike
Because men marry younger women and die earlier.
LikeLike
Reblogged this on IBHE Collaborative University.
LikeLike