I previously reported that divorce rates in the American Community Survey have fallen a fair amount since 2008, and especially from 2012 to 2014; and the experts at Bowling Green’s National Center for Family and Marriage Research (NCFMR) have reported that the trend continued through 2015.
Now, as I revise my book with the data through 2015, I estimated divorce rates in the American Community Survey across some key predictors to see if the decline since the first edition was concentrated in any particular group. The answer is mostly no, it’s across the board. Here, shown as the number of people in each year who said they divorced per 1000 people in that year that are married (click to enlarge).

The exception is across years married, which I show here instead of age. The 2012-2015 drops in divorce are largest among people married for the shortest duration, and for those married 35-49 years the rate actually increased. For more on this, see the great NCFMR work on “gray divorce.” Interestingly this happens as attitudes toward divorce are becoming steadily more permissive. (See the divorce tag for lots more on all this.)
Anyway, when I posted this on Twitter yesterday Jean Twenge reminded me of this article showing the trend toward less sex in America from 1989 to 2014, concentrated among married people. And that reminded me that the 2016 General Social Survey just came out, so we can update the reported sexual frequency trend.
To do this quick and dirty (no offense) I just ran a linear regression on the categorical GSS variable SEXFREQ, controlling for sex, age, and age-squared, for married people ages 18-54.* The results show the downhill trend Twenge and colleagues reported, and then a pretty dramatic drop in 2016, the biggest drop in the series. Yikes.
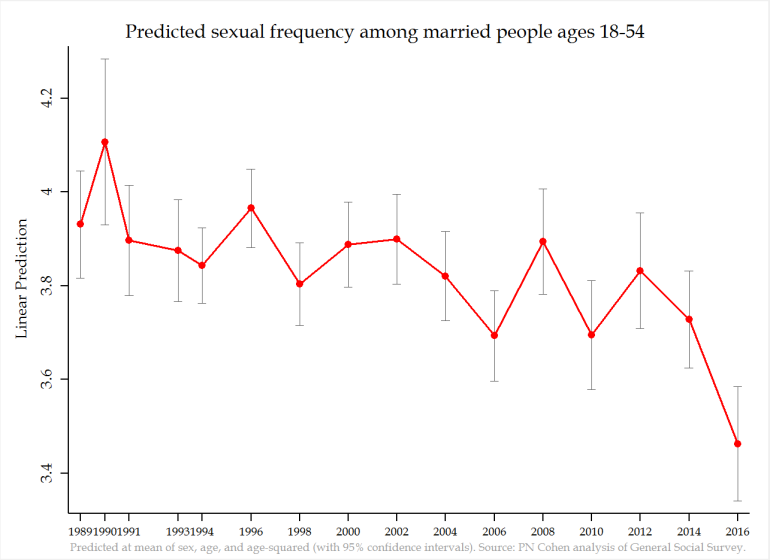
The variable SEXFREQ asks, “About how often did you have sex during the last 12 months?” with the options Not at all, Once or twice, Once a month, 2-3 times a month, Weekly, 2-3 times per week, and 4+ times per week. For reference, the figure is running from weekly down toward 2-3 times per month. I don’t take this literally, which is why I don’t mind treating it as linear, it’s just about the direction of change and the ballpark level. Others may disagree with this method.
So, that’s the news: divorce is down, and so is sex within marriage (as reported to survey takers). Open to interpretations.
* Here’s the Stata code:
reg sexfreq i.year i.sex c.age##c.age if age
margins
marginsplot
(And then I tinkered with the figure.)
Here’s the distribution of SEXFREQ, weighted, in 2016, for married people age 18-54:
| Percent | |
| not at all | 3.1 |
| once or twice | 9.4 |
| once a month | 14.6 |
| 2-3 times a month | 22.4 |
| weekly | 22.4 |
| 2-3 per week | 22.2 |
| 4+ per week | 5.9 |


It would be interesting to also look at some measure of long-distance relationships and spouses living apart. Maybe more married couples are attempting to have long-distance relationships instead of having one spouse give up their career/social life for the other.
LikeLike
Do you honestly believe that the answers to the divorce question and sexual frequency question have the same margin of error?
Everyone knows if they are divorced or not. Who is keeping a running count of their weekly sex frequency? What is “sex” defined as? Cudling? to orgasm?
LikeLike
Definitely don’t believe they have the same margin of error, although there is error in the divorce measure too (e.g., for some reason women always have higher divorce rates in this survey). I care much more about the trend than the level of the sex frequency variable.
LikeLike