Everyone wants a number. You want to know if the number is different from last year, or 100 years ago. Numbers are great. But the number you’re using is usually a statistic, a number calculated from a sample drawn from a population. You want a good number, you need a good sample. And a big one. And that’s going to cost you.
Who didn’t love the news recently that single British men ages 18-25 change their bedsheets only four times a year? Really? Really. How does anyone know this? Ergoflex, a memory-foam mattress distributor. At least UPI had the decency to report, “No survey details were provided,” although somehow Time found out the sample size was 2,004 (men and women, all ages). Rubbish, I reckon, or bonkers, or whatever. No one can resist a number; methods details don’t make it into the tweet version of the press release.
Here’s a more answerable question: What is the labor force participation rate for married, college graduate women with children, ages 25-54 in the United States? I’d say 76.1% — plus or minus a percentage point — based on the gold standard for labor force data collection, the Current Population Survey, easily analyzable these days for free with the IPUMS online tool.That’s from a sample of 60,000 households with a 90+% response rate, at a cost of umpteen million taxpayer dollars (well spent).
Here’s the trend in that number from 1990 to 2012, with 95% confidence intervals, based on the sample size, as calculated by IPUMS:
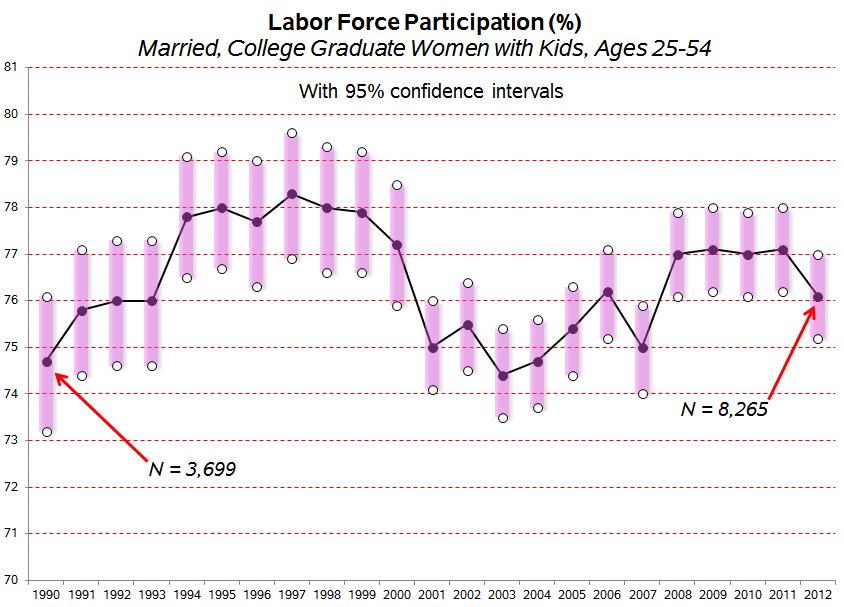
As more women have gotten college degrees, and the CPS sample has been enlarged, the sample size for this trend has grown and the error bars have shrunk, from a spread of almost 3 points to just less than 2. Still, there are only 8,265 of these women in the sample.
Only! Hold that up to a Gallup or Pew poll and compare confidence intervals when they start dividing and subdividing their samples. (Nothing against them — they give us the information we need to know how much variance there is in the estimates they put out, and then most people [+/- 51%] ignore it.)
There aren’t many one-year changes in this trend that are statistically significant at conventional levels. Of course, with this sample size you could say with confidence the labor force participation rate was higher in the late 1990s than the early 1990s (but check the survey redesign in 1994…), and higher again in the late 2000s than in the early 2000s. But were 2007 and 2002 sample flukes? And if so, what about 2012?
What about if you want a slightly smaller subgroup, say, Black married, college graduate women with children, ages 25-54. That’s a reasonable question. Here’s the trend (note the y-axis scale changed):

Now the sample size is a couple hundred and the confidence intervals are more than 6 points wide; there isn’t a pair of years in the trend that doesn’t have overlapping confidence intervals. And look at 2007 and 2012 — Black women are blipping in the opposite direction from the larger group in each of those years. Yes, if you put the whole Black trend in the blender with a time trend you have a significant decline of about a fifth of a point per year on average (and a sliver of this change is because of the increasing tendency of college graduates to be in grad school and not working — there are 13 of them in 2012, dragging down the participation rate by 0.6%). But don’t hang a lot on one year.
So, my advice for doing simple description:
- Eyes on the prize: who cares what the exact number is? Is it a lot or little, going up or going down, higher or lower than some other group? That’s usually what matters.
- Stick to data with reported methods
- Know the size of your subsamples, try to get confidence intervals
- Don’t fixate on (or report) small changes or differences (don’t use that second decimal place if the margin of error is 6%)
- For trends, pool data from multiple years, or report moving averages
- Spend tax money on surveys, not war


You should send this to WaPo, the AP, NY Times, LA Times, CNN, FNC, etc.
LikeLike
I love your final conclusion!
LikeLike