Most of the talk about income inequality is about inequality within countries – between rich and poor Americans, versus between rich and poor Swedes, for example. The new special issue of Science magazine about inequality focuses that way as well, for example with this nice figure showing inequality within countries around the world.
But what if there were no income inequality within countries? If everyone within each country had the same income, but we still had rich and poor countries, how unequal would our world be? It turns out that’s an easy question to answer.
Using data from the World Bank on income for 131 countries, comprising 91% of the world population, here is the Lorenz curve showing the distribution of gross national income (GNI) by population, with each person in each country assumed to have the same income (using the purchasing power parity currency conversion). I’ve marked the place of the three largest countries: China, India, and the USA:

The Gini index value for this distribution is .48, which means the area between the Lorenz curve and the blue line – representing equality, is 48% of the lower-right triangle. (Going all the way to 1.0 would mean one person had all the money.)
But there is inequality within countries. In that Science figure the within-country Ginis range from .24 in Belarus to .67 in South Africa. (And that’s using after-tax household income, which assumes each person within each household has the same income. So there’s that, too.)
The World Bank data I’m using includes within-country income distributions broken into 7 quantiles: 5 quintiles (20% of the population each), with the top and bottom further broken in half. If I assume that the income is shared equally within each of these quantiles, I can take those 131 countries and turn them into 917 quantiles (just assigning each group its share of the country’s GNI). These groups range in average income from $0 (due to rounding) in the bottom 10th of Bolivia and Guyana, or $43 per person in the bottom 10th of the Democratic Rep. of Congo, up to $305,800 per person in the top 10th of Macao.
To illustrate this, here are India, China, and the USA, showing average incomes for the quantiles and the countries as a whole:
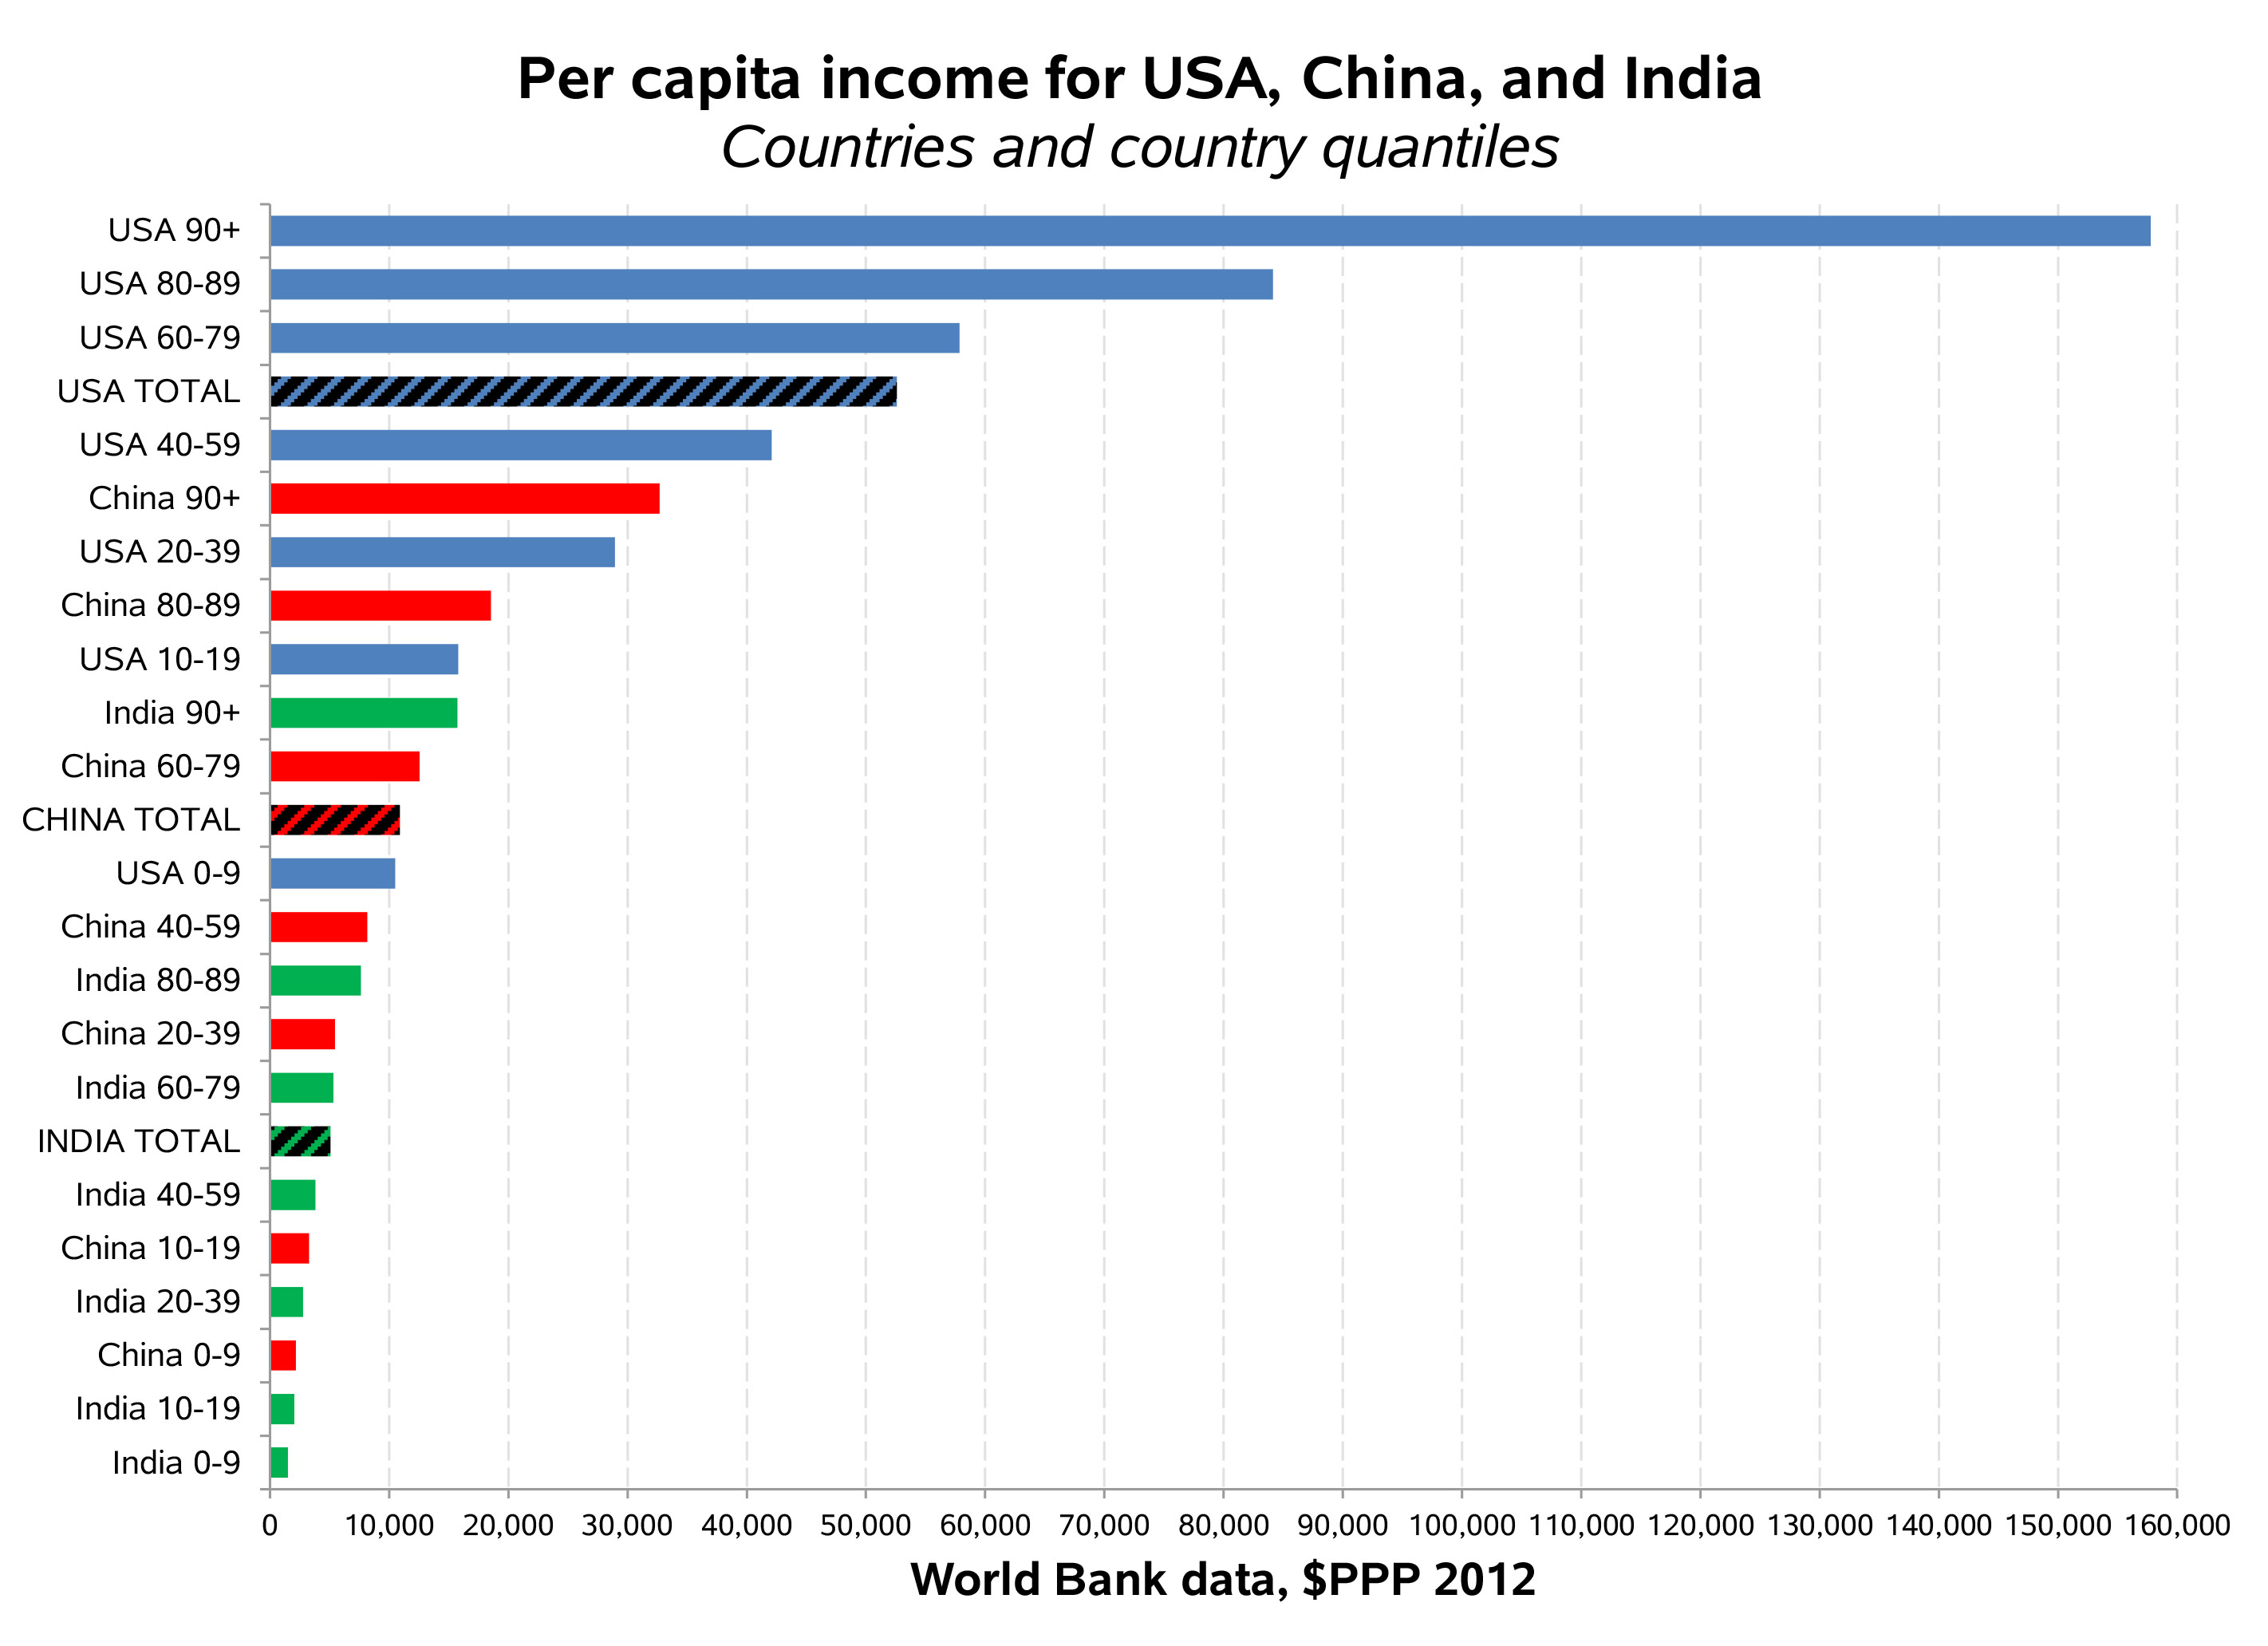
This shows that the average income of China’s top 10th is between the second and third quntiles of the US income distribution, and the top 10th of India has an average income comparable to the US 10-19th percentile range. Obviously, this breakdown shows a lot more inequality.
So here I add the new Lorenz curve to the first figure, counting each of those 917 quantiles as a separate group with its own income:

Now the Gini index has risen a neat 25%, to an even .60. Is that a big difference? Clearly, between country inequality — the red line — is vast. If every country were a household, the world would be almost as unequal as Nigeria. In this comparison, you could say you get 80% of the income inequality to show up just looking at whole countries. But of course even that obscures much more, especially at the high end, where there is no limit.
Years ago I followed the academic debate over how to measure inequality within and between countries. If I were to catch up with it again, I would start with this article, by my friends Tim Moran and Patricio Korzeniewicz. That provoked a debate over methods and theory, and they eventually published this book, which argues: “within-country analyses alone have not adequately illuminated our understanding of global stratification.” There is a lot more to read, but their work, and the critiques they’re received, is a good place to start.
Note: I have put my Excel worksheet for this post here. It has the original data and my calculations, but not the figures.


Reblogged this on The Life Of Von and commented:
Now that is interesting!
LikeLike
Are the incomes adjusted by purchasing power parity?
LikeLike
Ya
LikeLike
Reblogged this on GoEvenDeeper and commented:
Perhaps not surprising…
LikeLike
Reblogged this on uchechioma blog.
LikeLike
y Nigeria?
LikeLike