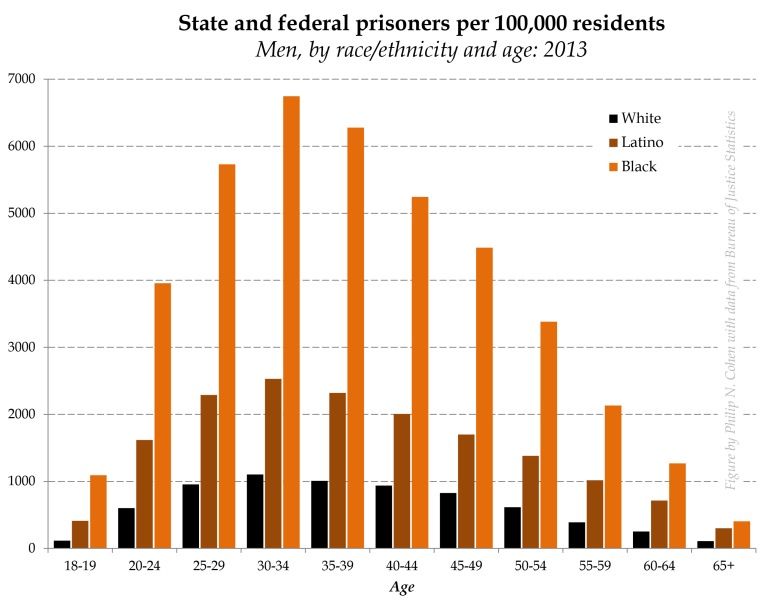
Here’s an update to the figures I posted in 2012.
Actually, the first figure isn’t really an update because the Bureau of Justice Statistics doesn’t seem to publish complete incarceration rates by age, race/ethnicity, and sex anymore. These are just state and federal prisoners sentenced to a year or more — jail isn’t included. (This is from the report called Prisoners in 2013, because the “Correctional Populations in…” series doesn’t include the race/ethnic breakdown anymore.)
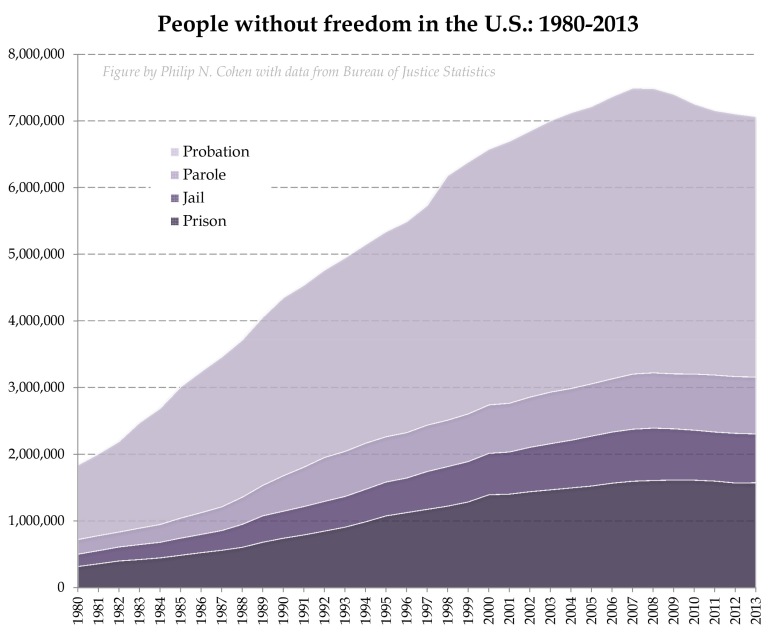
The highest bar in the 2010 figure was 9,892 per 100,000 for Black men in their early 30s, much higher than these — as you can see in the second figure, jail adds almost half again to the number of people in prison. So this isn’t a good measure of the total impact of incarceration, but it does show the racial/ethnic inequality: the Black bars are between 3.8-times higher than the White bars (age 65+) and 9.5-times higher (ages 18-19); the Latino bars are between 2.1- and 3.6-times higher.
And here is the total trend of unfree people: prison, jail, parole, and probation, from Correctional Populations in 2013:
This includes people of all genders, but doesn’t include some others held against their will in other institutions (which are much smaller). And we don’t get the race/ethnic breakdown. You can see that we’ve had some declines. Prisoners have dropped 2.5% since 2009. The fact that the parole numbers are still rising is one indication of how long it will take to get the total amount of unfreedom down — if we really do continue in that direction.
I reviewed some of the connections between mass incarceration and family inequality in these and related posts:


Whereas I appreciate your goal of updating the data, I wish you had extended the graph to 1965 or so (a s in https://en.wikipedia.org/wiki/Incarceration_in_the_United_States) to show that the explosion of people in prison or jail (parole or probation is a cumulative or integration of data and so not applicable) happened much after 1975 (approximately after 1979 I believe).
The increase in african american population in jail happened ~15 years after the explosion of single motherhood, even if I do not believe a causal link exists. It would be worthwhile seeking a relationship between the growth of people without freedom and the end of growth in manufacturing jobs (the beginning of the great recession) and immigration of blue collar workers into the country. The economic causes are almost never touched upon here, and Marx will be a great help.
LikeLike
“The increase in african american population in jail happened ~15 years after the explosion of single motherhood, even if I do not believe a causal link exists.”
The increase in african american population in jail happened ~15 years after the explosion of crime, and I do believe a causal link exists.
LikeLike