Updating a 2013 post with the 2016 General Social Survey. Not a lot of interpretation, just some facts.
The GSS has, since 1972, asked Americans:
If you were asked to use one of four names for your social class, which would you say you belong in: the lower class, the working class, the middle class, or the upper class?
The latest data release, for 2016, confirms what I noticed before: a big rise in the percentage of people describing themselves as “lower class” since the 2008 recession, from 5% to 9%. This is striking when you zoom in on it:

Now, looking at the trend in all four classes, it’s clear there has been a decline in the proportion of people calling themselves “middle class” — which hit its lowest level ever in the series, 41%:

Is this important? I don’t know. The most common tendency in sociology these days is to use measures of education (one’s own education, or one’s parents’) to indicate social class, which is generally thought of in material terms, rather than as an identity issue (or as a question of what people actually learn in school). Of course there are sociologists who study class identity issues, but as a survey item I bet it’s more likely to show up in political science research.
Of course the political salience of “working class” was heightened by the election in 2016 (although the phrase itself was more likely used as an adjective than a noun; the noun in American politics remains “working families,” a term I dislike). And by “working class” of course most people meant White working class. A Google search of the New York Times site for [“White working class” 2016] produces 1,050 hits; [“Black working class” 2016] yields 37. But Blacks are considerably more likely to identify as “working class,” and less likely to choose “middle class,” than are Whites. Here is the breakdown for 2016 (at the mean of controls for age and sex):

Of course that doesn’t account for common correlates of class identity; it’s just a description of the groups. I looked a little more closely at income. Here is how people report class identities by family income, this time at the mean of controls for age, sex, race/ethnicity, and marital status (partly to account for family size)*:
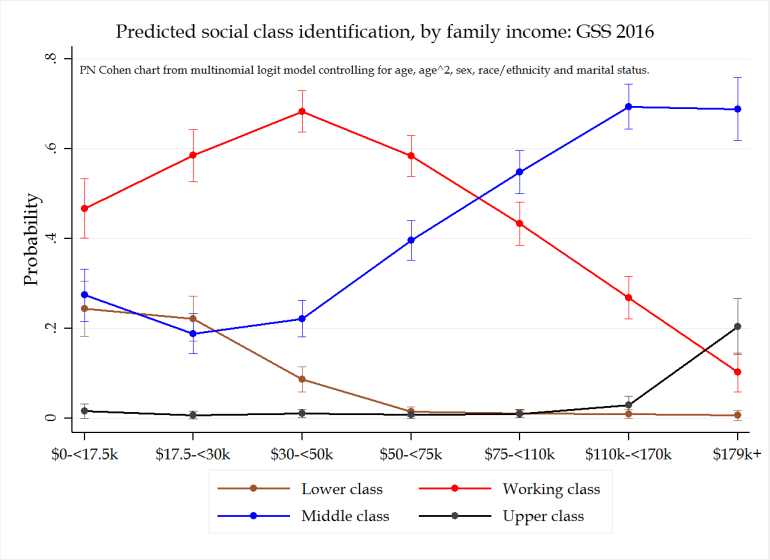
This shows that “working class” is most common among those in the $30,000-$50,000 range, and it dominates under $75,000, while “middle class” picks up most people over $75,000. Only people in the top bracket — and only a small proportion of them — identify as “upper class.”
I did a little checking to see what difference class makes on some common political issues. Regressions holding constant sex, race/ethnicity, education, income, marital status, and region, showed that working class people were more Democratic than middle class people (on a scale from strong Dem to strong Rep); but middle class people are more pro-choice, and also more likely to think “people can be trusted.” In similar models, class didn’t do much to explain confidence in organized labor, support for same-sex marriage, attidues toward taxes on the rich, the likelihood of owning a gun, political views (liberal v. conservative), or traditional gender attitudes. Still, I think it’s worth asking.
In summary, it’s interesting that the self-identified class structure may be shifting relatively rapidly, and the implications are to be determined.
* Code for the income regression, using the full GSS dataset through 2016, available here.
gen rndwt=round(wtssall)
recode income16 (1/11=1) (12/15=2) (16/18=3) (19/20=4) (20/22=5) (23/25=6) (26=7) , gen(incate)
label define cl_lbl 1 "$0-<17.5k"
label define cl_lbl 2 "$17.5-<30k", add
label define cl_lbl 3 "$30-<50k", add
label define cl_lbl 4 "$50-<75k", add
label define cl_lbl 5 "$75-<110k", add
label define cl_lbl 6 "$110k-<170k", add
label define cl_lbl 7 "$179k+", add
label values incate cl_lbl
mlogit class c.age#c.age i.sex i.race i.marital i.incate [weight=rndwt] if year==2016
margins incate
marginsplot


Only skimmed but yes this is important. A “truism” I learned in grad school is this: most people identify as middle class (no matter what a “sociologist” might think). It is just the way it is.
The graphs show some movement in that identification. Fascinating.
LikeLike